

Three Market-Moving Economic Indicators to Watch

Among all of the economic indicators released each month, three reports in particular can move the market: the Employment Situation, gross domestic product, and Personal Income and Outlays.
The Employment Situation
Each month, the Bureau of Labor Statistics (BLS) publishes the Employment Situation Summary report based on information from the prior month. The data for the report is derived primarily from two sources: (1) a survey of approximately 60,000 households, or about 110,000 individuals (household survey), and (2) an establishment survey of over 650,000 worksites. The information contained in each report includes the total number of employed and unemployed people, the unemployment rate, the number of people working full time or part time, average hourly and weekly earnings, and average hours worked per week.
According to the BLS, when workers are unemployed, they, their families, and the country as a whole can be negatively impacted. Workers and their families lose wages, and the country loses the goods or services that could have been produced. In addition, the purchasing power of these workers is lost, which can lead to unemployment for even more workers.
Investors pay particular attention to the information provided in this report. For instance, a rising unemployment rate may indicate a slowing economy. In this scenario, stock values may decline with falling corporate profits, while bond prices may rise as yields fall in response to lower interest rates. Slower wage growth may also be a sign of lower inflation and interest rates, and reduced economic productivity.
Gross domestic product
Gross domestic product (GDP) measures the value of goods and services produced by a nation's economy less the value of goods and services used in production. GDP offers a broad measure of the nation's overall economic activity in the U.S. and serves as a gauge of the country's economic health. GDP contains a vast amount of economic information, including gross domestic income (the net of incomes earned and costs incurred in the production of GDP); gross output (the value of the goods and services produced by the nation's economy); gross domestic purchase price index (measures the value of goods and services bought by U.S. residents); personal consumption expenditures (PCE) price index (costs of consumer goods and services); and profits from current production (corporate profits).
GDP can offer valuable information to investors, including whether the economy is expanding or contracting, trends in consumer spending, the status of residential and business investing, and whether prices for goods and services are rising or falling. A strong economy is usually good for corporations and their profits, which may boost stock prices. Increasing prices for goods and services may indicate advancing inflation, which can impact bond prices and yields. In short, GDP provides a snapshot of the strength of the economy over a month and a year and can play a role when making financial decisions.
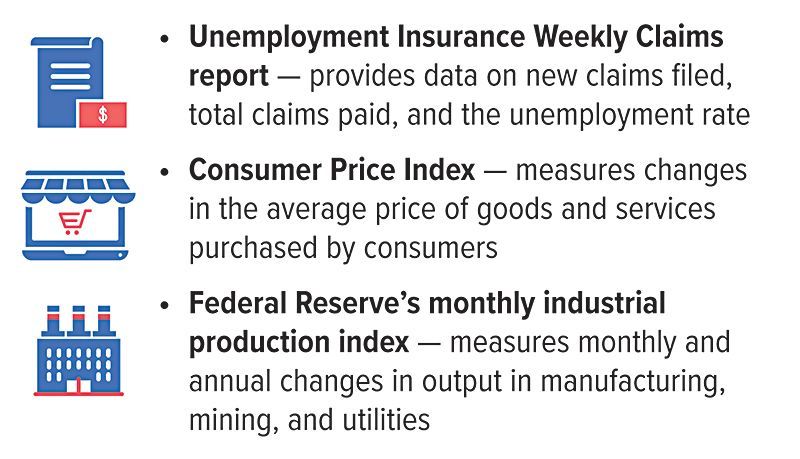
Other Important Economic Indicators
Personal Income and Outlays
The Personal Income and Outlays report measures household income, expenditures, and savings. It also includes data on consumer prices for goods and services. In particular, this report includes data on personal income, disposable (after-tax) personal income, personal consumption expenditures, personal savings, and prices for consumer goods and services as measured by the PCE price index.
In general, consumer spending, which accounts for more than two-thirds of the economy, usually influences market performance. Knowing what consumers are buying (i.e., durable goods, nondurable goods, or services) may offer insight into how various market sectors might perform. Changes in income and spending can have a direct impact on the market. Greater spending usually enhances corporate profits and stock values and vice versa. While the Consumer Price Index may be the more recognized measure of inflation, the PCE price index is the Federal Reserve's preferred measure of inflationary (or deflationary) trends. The rate of inflation and interest rates often move in the same direction because interest rates are the primary tool used by central banks (including the Federal Reserve) to manage inflation. Rising inflation usually prompts the Fed to increase interest rates, while falling inflation (and slowing economic growth) might lead to a decrease in interest rates to promote borrowing and stimulate the economy.
All investing involves risk, including the possible loss of principal, and there is no guarantee that any investment strategy will be successful.
All Securities Through Money Concepts Capital Corp., Member FINRA / SIPC
11440 North Jog Road, Palm Beach Gardens, FL 33418 Phone: 561.472.2000
Copyright 2010 Money Concepts International Inc.
Investments are not FDIC or NCUA Insured
May Lose Value - No Bank or Credit Union Guarantee
This communication is strictly intended for individuals residing in the state(s) of MI. No offers may be made or accepted from any resident outside the specific states referenced.
Prepared by Broadridge Advisor Solutions Copyright 2020.